As we were saying, the first step is evaluate the level of noise produced in the workplace during work time, that is, exposure time.
Noise is measured and expressed using a sound level meter in decibels (dB), with the A-weighted normalisation, and will be expressed with the acronyms dB(A).
Spanish legislation requires the implementation of preventive measures if daily equivalent noise levels of 80 dB(A) and peak levels of 140 dB are exceeded.
- If the noise exceeds 80 dB(A) equivalent daily level, The worker must be informed and trained on the risks related to noise exposure and on how to prevent them (working methods, protections, etc.). An initial audiological assessment and periodic checks are carried out, the results are reported, and hearing protectors are provided to those who request them.
- If the noise exceeds the 85 dB(A) daily equivalent level, In addition to the measures from the previous point, regular hearing checks (every three years) must be carried out, and hearing protection must be supplied to the workers.
- If the noise exceeds 90 dB(A) equivalent daily level and 140 dB peak, In addition to the above measures, it is necessary to investigate the causes of these limits being exceeded, implement technical measures to reduce noise propagation, carry out annual hearing function checks, and restrict access to the affected workstations; all workers must use hearing protection.
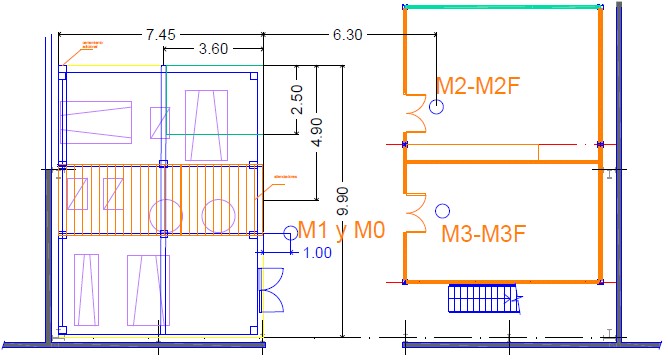
To do this, we take the measures necessary with the teams idle:
Measurement M0-RF: Background noise measured 1m from the area of stationary equipment and compressors. Measurement M1: 1m from the main focal point.
Measurement M2 – Noise in room at 1m from bottom floor door
Measurement M3 – Noise inside room at 1m from lower floor door
Once the measurements were taken, we proceeded to measure the noise level generated, where the following data were obtained:
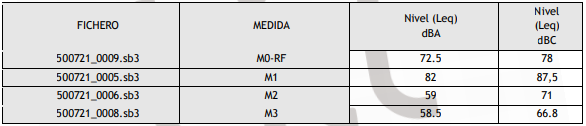
The results obtained in the different positions were based on obtaining a reference frequency spectrum and verifying the sound pressure drop with distance. The similarity of the results, which confirms the pattern and noise spectrum, can be seen in the following graphs.
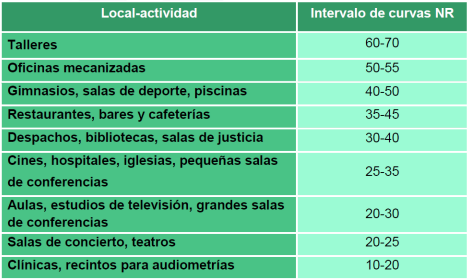
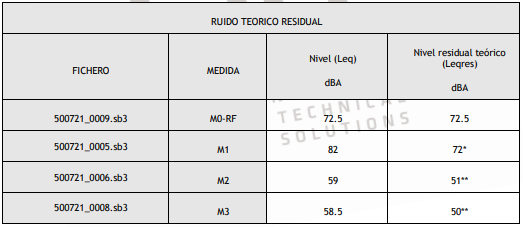
The background noise measured M0-RF was 72.5dB(A), meaning that without the compressors running, there is already a background noise (from other equipment operating) far from the 80dB(A) that would lead to the application of actions, but due to the existence of offices, the maximum permissible immission level according to the NR* curves would be 50-55dB.
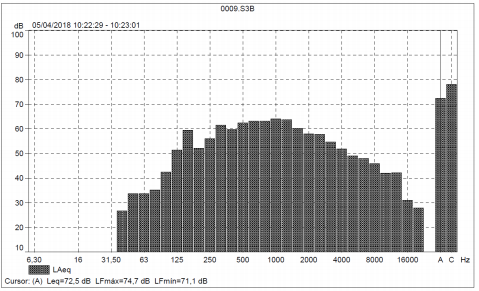
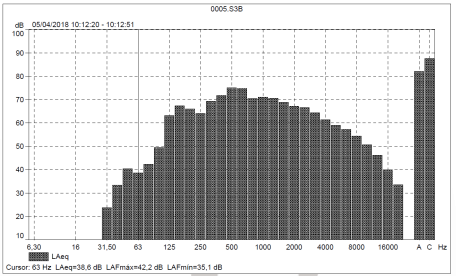
Spectrum of measurements taken
M0-F Measure
Measure M1
M2 measurement
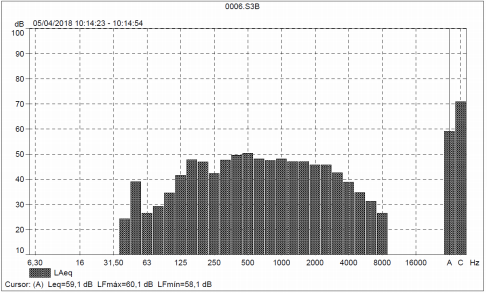
M3 measurement
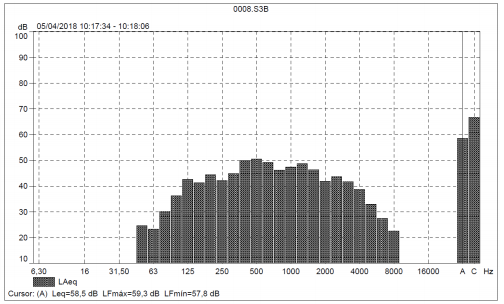
Table of acceptable NR curve intervals
The next step was to calculate the insulation. In the following table, we can observe the results obtained.
Calculation of insulation
For the design of acoustic attenuation measures, we used measurement M1 as representative of the source, and measurement M3 as representative of the receiver.
Calculation of the global insulation value.
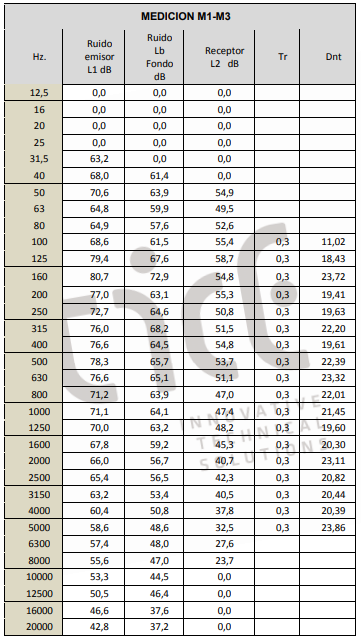
Measurement results
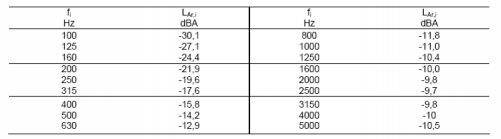
The table above shows the values of “DnT” at each frequency in decibels.
The LAr,i values are given by the following table of the A-weighted normalised pink noise spectrum values of the DB-HR.
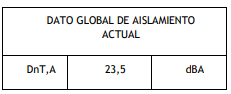
The DnT,A obtained was 23.5 dBA. The noise had to be reduced from M3=58 dBA to 50-55 dBA, which would require an 8 dBA increase in overall insulation.
Corrective measures
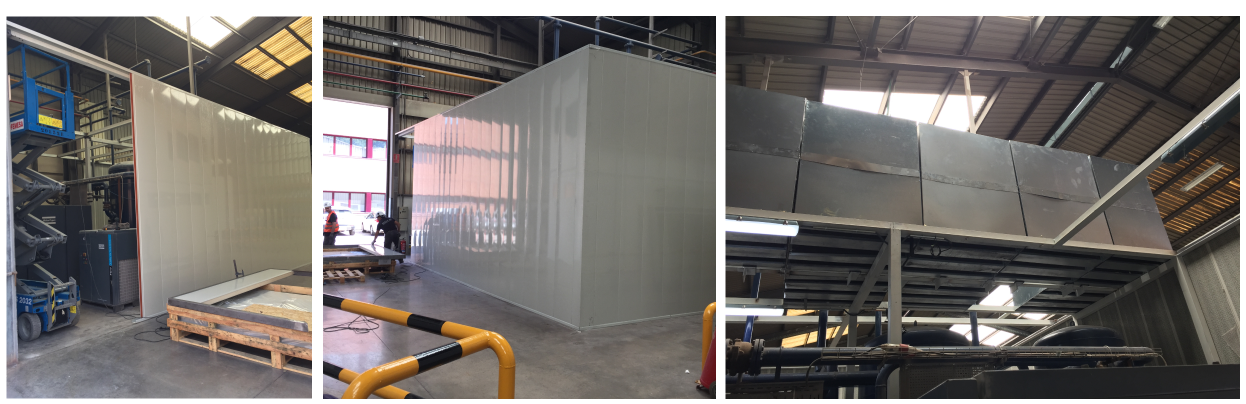
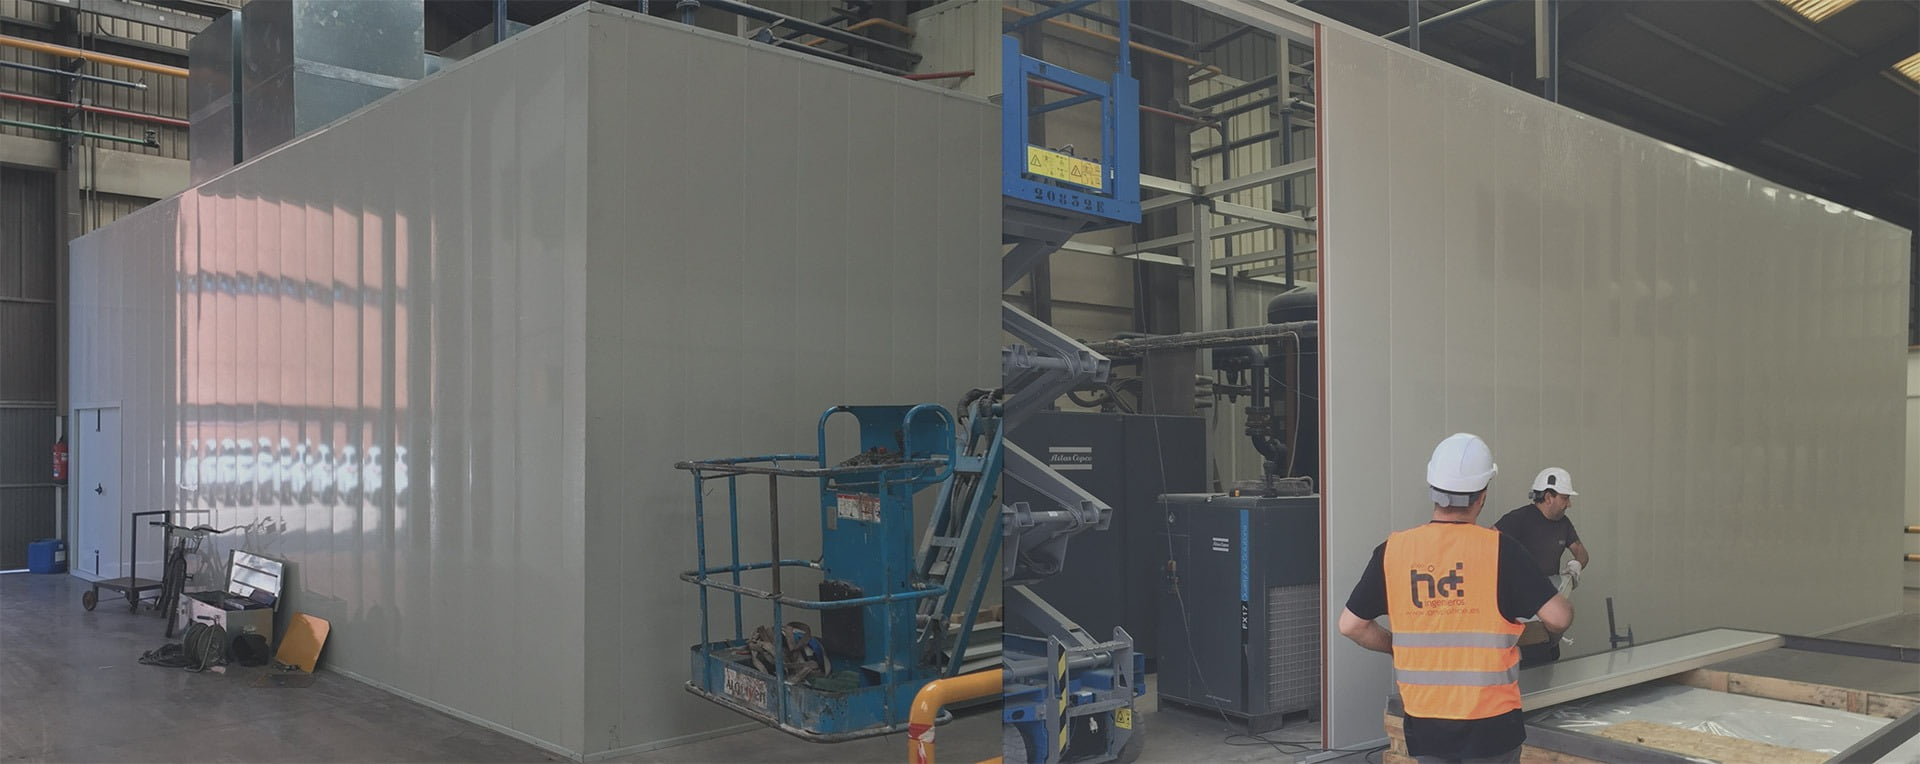
Following the data obtained, it was considered that the best solution was the implementation of a Acoustic cabin, composed of absorbent, insulating panels, which would reduce noise and, in turn, the disturbance generated by it. Meanwhile, to eliminate the problem of high temperatures, a roof full of silencers would be generated.
The aim was to achieve sufficient attenuation by installing an L-shaped enclosure and a roof around the compressors, thereby creating an acoustic booth to contain the noise generated by them while in operation. This way, their impact does not increase the existing overall background noise M0-RF, 72dBA+3Db.
Once the solution had been implemented, the next step was to remeasure the noise, vibration, and temperature levels of the emission source to observe that we had successfully achieved noise reduction.
From this second measurement study, we obtained the following results:
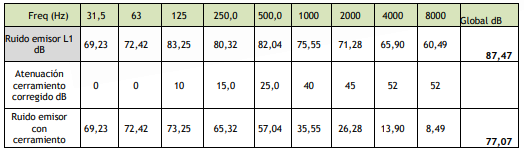
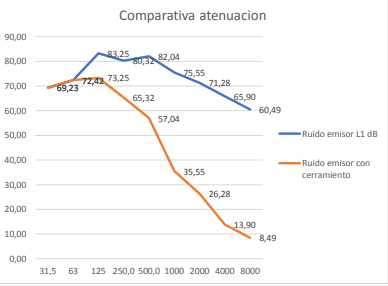
We achieved a notable reduction in higher frequencies, dropping from 60.49 to 8.49, for example, reaching an attenuation of 52.
The noise measurement at point M1 during full machinery operation was 77.07 decibels. This achieved an overall reduction of 10dB(A) ± 3dB.
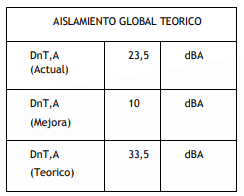
The solution of installing enclosures on the compressors increased the overall DnT,A because the noise source was reduced:
The following graph shows the attenuation comparison between L1 dB emission noise and emission noise with an enclosure:
The enclosure the global isolation increased by 10dB(A) ± 3dB, so within the receiver, the target of 50dBA was met, taking into account that the background noise remained at 72.5dB(A).
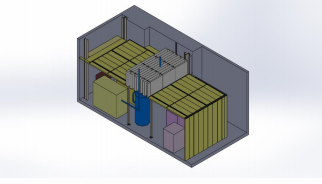
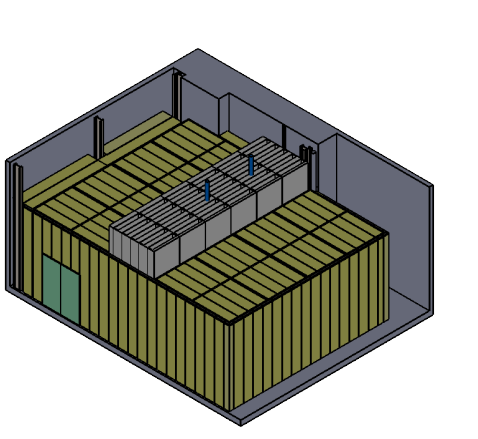
3D preliminary design – Cross-section.
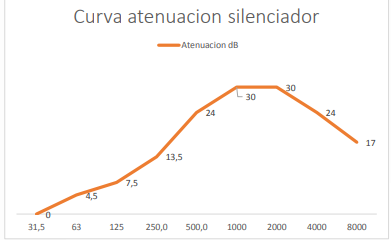
Regarding the acoustic enclosure, the upper part needs to have silencers that allow room ventilation. For this purpose, they must meet the acoustic insulation condition of >= 10dB and the necessary ventilation surface area.
This heat is dissipated by ventilating the room. The amount of ventilation air is determined by the size of the compressor and the cooling method. Either water or air, hence the specification of this detail in the equipment description section.
The ventilation air for air-cooled compressors contained approximately 95% of the energy consumed by the electric motor in the form of heat. This heat had to be removed to keep the temperature in the compressor room at an acceptable level.
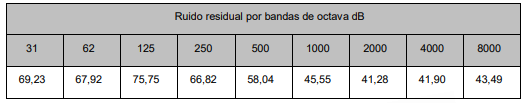
Residual noise in octave bands dB.
Preliminary 3D design – Top view.
Theoretical residual noise
In conclusion, by installing the acoustic enclosure, we achieved an overall reduction from 87.47 to 77.07 dB, with higher frequencies dropping from 60.49 to 8.49 dB, for instance, reaching an attenuation of 52 dB.
- The new measurement at point M1 of total decibels during full operation was 77.07, achieving an overall reduction of 10dB(A) ± 3dB.
- The enclosure increased the global isolation by 10dB(A) ± 3dB, so inside the receiver the target of 50dBA was achieved, taking into account that the background noise remained at 72.5dB(A).
Furthermore, the acoustic enclosure needed to have silencers at the top to allow for the ventilation of the room. For this purpose, they must meet the acoustic insulation condition of >= 10dB and the necessary ventilation surface.